Using Visual Studio to Debug Mono
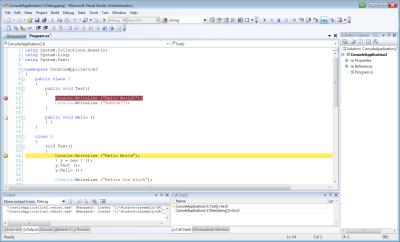
The following screenshots shows Visual Studio debugging a remote Mono process running on a Linux box.

Breakpoints, current line, and stack traces.
The setup works like this: you run a debugging server on Linux. On Windows you install a Visual Studio extension that provides a Debugging Engine and the configuration tools to start your application.
Then you start your application from Visual Studio (Tools/Launch with Mono) which will send the binaries and debug information over to Linux and execute it.

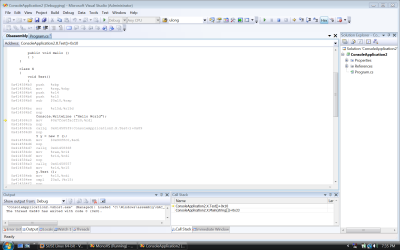
Showing the disassembled code generated by Mono's JIT
The core of the above work is to get the Windows to Linux debugging functionality enabled. We will have more news when the debugging experience is more complete and we are approaching the time to test drive it.
If you are interested in trying it out, sign up for our preview on our web site.
Debugging Support
Mono 2.0 will for the first time include a debugger, the command line mdb command.
Beyond this, we want to offer GUI debugging. The native solution is being built on top of MonoDevelop and will be available when we release MonoDevelop 2.0. It will work on both Linux and MacOS hosts.
The second GUI engine will be the above Visual Studio plugin for developers that use Windows as their main OS and Visual Studio as their IDE.
More Visual Studio Integration
In addition to this work to integrate Visual Studio with Mono for remote debugging, thanks to the Summer of Code (Ed Ropple) and Jonathan Pobst's work in this hack week we got some support to run applications on Mono/Windows and run our Mono Migration Analysis tool.
Jonathan's work is available today as an MSI, check out his post for more details.
You can also check Ed's summer of code report on CloverLeaf.
Posted on 04 Sep 2008
Blog Search
Archive
- 2024
Apr Jun - 2020
Mar Aug Sep - 2018
Jan Feb Apr May Dec - 2016
Jan Feb Jul Sep - 2014
Jan Apr May Jul Aug Sep Oct Nov Dec - 2012
Feb Mar Apr Aug Sep Oct Nov - 2010
Jan Feb Mar Apr May Jun Jul Aug Sep Oct Nov Dec - 2008
Jan Feb Mar Apr May Jun Jul Aug Sep Oct Nov Dec - 2006
Jan Feb Mar Apr May Jun Jul Aug Sep Oct Nov Dec - 2004
Jan Feb Mar Apr May Jun Jul Aug Sep Oct Nov Dec - 2002
Jan Feb Mar Apr May Jun Jul Aug Sep Oct Dec
- 2022
Apr - 2019
Mar Apr - 2017
Jan Nov Dec - 2015
Jan Jul Aug Sep Oct Dec - 2013
Feb Mar Apr Jun Aug Oct - 2011
Jan Feb Mar Apr May Jun Jul Aug Sep Oct Nov Dec - 2009
Jan Feb Mar Apr May Jun Jul Aug Sep Oct Nov Dec - 2007
Jan Feb Mar Apr May Jun Jul Aug Sep Oct Nov Dec - 2005
Jan Feb Mar Apr May Jun Jul Aug Sep Oct Nov Dec - 2003
Jan Feb Mar Apr Jun Jul Aug Sep Oct Nov Dec - 2001
Apr May Jun Jul Aug Sep Oct Nov Dec