Introducing Debugging for MonoTouch
![]() Today we
released MonoTouch
1.2.
Today we
released MonoTouch
1.2.
Perhaps the most important new feature in MonoTouch 1.2 is that it now has a debugger that supports debugging on both the iPhone simulator and on the iPhone/iPod Touch.
The debugger is integrated directly into MonoDevelop/OSX. All you have to do is select one of the debugging configurations (either Debug|iPhone or Debug|iPhoneSimulator):

and run your application:

To set breakpoints, you use the usual MonoDevelop UI, just click on the left-hand side of the editor, or use Command-/:

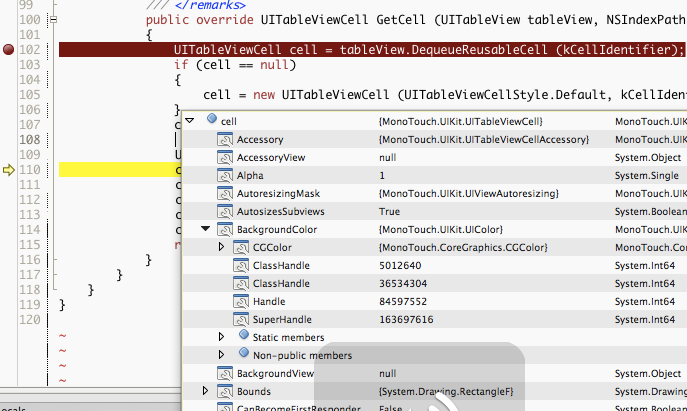
The debugger offers the usual watch windows, and also allows you to navigate object state by hovering over the value in the IDE:
The Technology
Although this was developed for the iPhone, I should probably have said that this is Mono's new soft debugger engine.
The iPhone is once again a challenging platform to get debugging working on. Since Apple has not published the information necessary to implement something like GDB or Mono's own MDB and we are not going to reverse engineer the protocol, instead we created a new way of debugging Mono applications.
The Mono Debugger for the iPhone platform uses a soft-debugger. Unlike traditional debuggers that act like a fully controlling entity over the Mono process, the soft-debugger is actually a debugger that is built into the Mono process itself. MonoDevelop communicates with this debugger over a compact protocol, similar to what has been done in the past with Java debuggers:
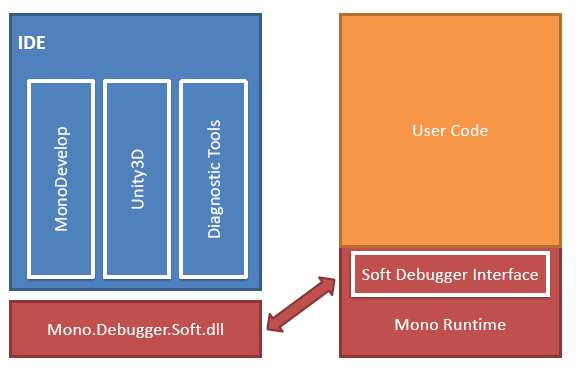
We are providing a new library, the Mono.Debugger.Soft.dll that encapsulates the protocol and offers an API that developers can use to debug a remote Mono process.
On systems where we have access to breakpoints the soft debugging engine will use the standard operating system facilities to single step and set breakpoints.
But on systems like the iPhone and some video game consoles where there is no way to modify memory without special privileges we had to resort to a different technique. The Mono static compiler inserts special code at every sequence point that checks for single stepping or breakpoints. The code generated during these debug builds is larger, but it allows us to support the iPhone without having to resort to undocumented APIs in any form or shape.
MonoDevelop and the iPhone
When the user selects an application for debugging, MonoDevelop configures the application to contact MonoDevelop on startup and link the debugger to it, starts listening on a couple of ports (one for the debugging protocol, and one for redirecting standard output/standard error) and waits for the application on either the iPhone simulator or the iPhone to contact it.
Upon contact, the debugger handshake takes place and operation continues. For the simulator, this takes place with a local socket; for the device, this happens over a TCP/IP socket over WiFi.
One of the nice side effects of this approach to debugging is that it is possible to distribute binaries to testers (using the Ad-Hoc distribution model) and debug problems on a user's iPhone over the network.
To support this scenario, when you build applications with the "Debug|iPhone" configuration, MonoDevelop will modify your application's Settings file on the iPhone.
This allows your beta-testers to enable debugging and connect to your debugger for inspection. This is what the settings looks like:
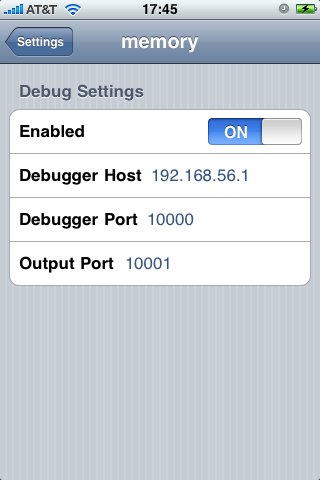
The first port is the port where MonoDevelop will be listening to. The second port is the port where the standard output and standard error will be redirected to.
All of the Console.Output and Console.Error output will be sent to this port when debugging is enabled on the application.
Pros and Cons
There are pros and cons to the soft debugger approach.
Soft debuggers are unable to do low-level debugging or debug Mono itself (mixed-mode debugging) and they are unable to stop applications at will, all it can do is request politely that the application stops, and when the Mono runtime decides that it is a good time to stop, it will stop.
On the pro side, the soft debugger is easier to port and is more robust as it eliminates some dead-lock situations. These can happen when the runtime has been forcefully stopped by the debugger, and then the debugger invokes methods on the target. These methods in turn might require an internal lock that is currently held by a different thread.
The Protocol
The protocol used between the debugging agent running inside the Mono process and a debugger is implemented in the debugger-agent.c file.
Availability
MonoTouch customers will be offered the update the next time they start MonoDevelop or if they manually "Check for Updates" on the MonoDevelop IDE.
Users of MonoTouch for the iPhone simulator can get the it from the trial page.
The source code for the soft-debugger is available on SVN. The API to communicate with the Mono runtime is available in the Mono.Debugger.Soft assembly and the debugger itself has already been integrated into the Mono 2.6 branch and Mono trunk on SVN.
This should prove useful to other users of Mono that might benefit from a soft debugger like Unity3D or Second Life.
Screenshots
Brent has a nice gallery of screenshots of the debugger in action on his MonoTouch 1.2 with debugging released! post.
Posted on 04 Nov 2009
Blog Search
Archive
- 2024
Apr Jun - 2020
Mar Aug Sep - 2018
Jan Feb Apr May Dec - 2016
Jan Feb Jul Sep - 2014
Jan Apr May Jul Aug Sep Oct Nov Dec - 2012
Feb Mar Apr Aug Sep Oct Nov - 2010
Jan Feb Mar Apr May Jun Jul Aug Sep Oct Nov Dec - 2008
Jan Feb Mar Apr May Jun Jul Aug Sep Oct Nov Dec - 2006
Jan Feb Mar Apr May Jun Jul Aug Sep Oct Nov Dec - 2004
Jan Feb Mar Apr May Jun Jul Aug Sep Oct Nov Dec - 2002
Jan Feb Mar Apr May Jun Jul Aug Sep Oct Dec
- 2022
Apr - 2019
Mar Apr - 2017
Jan Nov Dec - 2015
Jan Jul Aug Sep Oct Dec - 2013
Feb Mar Apr Jun Aug Oct - 2011
Jan Feb Mar Apr May Jun Jul Aug Sep Oct Nov Dec - 2009
Jan Feb Mar Apr May Jun Jul Aug Sep Oct Nov Dec - 2007
Jan Feb Mar Apr May Jun Jul Aug Sep Oct Nov Dec - 2005
Jan Feb Mar Apr May Jun Jul Aug Sep Oct Nov Dec - 2003
Jan Feb Mar Apr Jun Jul Aug Sep Oct Nov Dec - 2001
Apr May Jun Jul Aug Sep Oct Nov Dec